
Library Cleaning in Ometa Flow
Library annotation is one of the first steps in small molecule analysis. In this process, experimental MS/MS spectra are compared against reference spectra from known compounds. Over the past decade, community-driven efforts have expanded public spectral libraries to include millions of spectra submitted by researchers worldwide.
This scale has transformed metabolomics research. But it has also introduced new challenges. Large, rapidly-growing libraries inevitably contain inaccuracies: incomplete structural information, inconsistent metadata, low-quality spectra, and incorrect masses. Historically, library verification has relied on manual curation or one-time quality control efforts. Manual curation does not scale to datasets containing millions of spectra and cannot keep pace with continual growth. One-time verification approaches, while useful, are exceptionally time and resource-intensive and do not account for newly-added spectra or improvements in instrumentation and data standards. A spectrum that was considered high-quality twenty years ago may no longer meet modern standards for resolution, metadata completeness, or structural validation.
To address these challenges, we developed an automated, modular library cleaning pipeline designed to be reproducible, tunable, and repeatable as libraries evolve.
Methods
Below is a brief overview of the library cleaning workflow. Each step is described in further detail in our accompanying blog post.
Step 1: Remove tentative matches. Removes spectra with compound names containing “tentative” or “suspect”. These entries often represent provisional annotations rather than verified reference standards.
Step 2. Remove low-resolution spectra. Removes spectra whose precursor masses contain fewer than two decimal places (optional).
Step 3. Remove low-intensity peaks. Removes MS2 fragment peaks below 0.01% of the maximum peak intensity (optional, tuneable).
Step 4. Remove sparse spectra. Removes spectra with less than six MS2 peaks (optional, tuneable). Since many library matching workflows require at least six matching peaks, sparse spectra are unlikely to contribute meaningfully to downstream analyses.
Step 5. Validate structures. Removes spectra lacking valid structural identifiers (SMILES, InChI, or InChIKey). This ensures that all spectra can be unambiguously tied to a chemical structure.
Step 6. Validate mass. Ensures that parent mass, adduct, and precursor m/z are consistent and agree with the validated structure. If these values do not align—and no common adduct can explain the discrepancy—the spectrum is removed.
Step 7. Validate charge. Uses the adduct from the previous step to assign the correct charge.
Step 8. Validate compound names. Retrieves the IUPAC name and common synonyms of a compound using its InChIKey.
Several of these steps are optional or adjustable. For instance, the noise filter and sparsity thresholds can be tuned based on data quality or analysis goals. In addition, spectra filtered at each step are saved in separate files that can be used to assess results and, in some cases, create their own libraries (for instance, a library of low-resolution data).
Spectral Merging
After filtering, spectra corresponding to the same compound adduct are merged into a consolidated reference spectrum. MS2 peak intensities for this spectrum are calculated as the weighted average of all normalized peak intensities. This approach preserves all observed peaks while increasing the weight of fragments observed across replicate spectra. Currently, merging does not take into account instrument type or collision energy, which can significantly affect MS2 fragmentation. Unfortunately, these values are often not reported for public library spectra, and cannot be empirically determined in the same way as adduct or charge. How to best incorporate these parameters into cleaned libraries will be the subject of future development.
The entire workflow is automated, modular and built for routine use, enabling libraries to be regularly cleaned as new spectra are incorporated.
Results
To evaluate the performance of the workflow, the library cleaning pipeline was applied to 75 spectral libraries available through GNPS2. Together, these libraries comprised 928,631 spectra spanning over 103,000 unique InChIs. The workflow completed in 4 hours, using 13.6 CPU hours and 7 GB RAM.
Using default settings, the workflow removed 312,533 (34%) of the input spectra. Most of these spectra (74%) were removed in Steps 4 (sparse spectra) and 5 (missing structural identifiers). It is important to note that not all of the removed spectra are incorrect. For example, a spectrum without structural annotation may be accurate, but its validity cannot be readily confirmed within a high-throughput, automated framework.
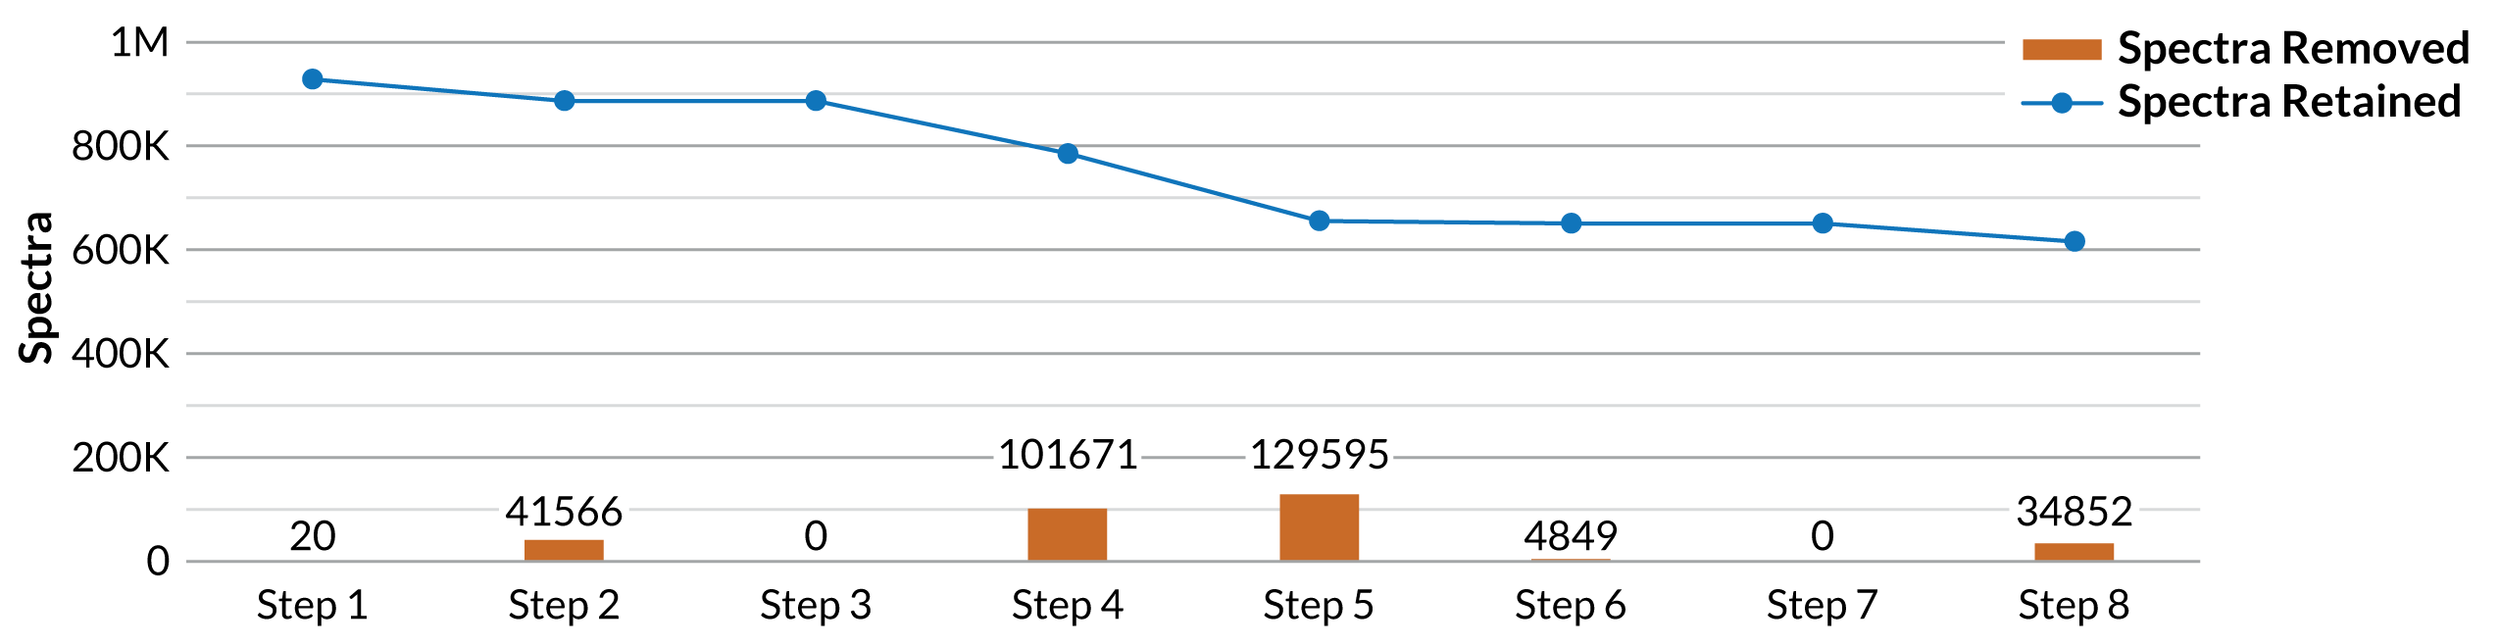
On a per-library basis, removal rates ranged from 0–100%. In some cases, high removal rates were expected (e.g., libraries dominated by low-resolution data). In others, high removal rates suggested widespread inconsistencies or metadata errors.
These inaccuracies were most clearly seen in spectra that fail the mass validation step (Step 6). For instance, this step flagged ten library spectra labeled as Dorzolamide Hydrochloride (Formula: C10H17ClN2O4S3, MW: 360.90). The structural information for these entries corresponded to an entirely different compound: 1-(2,6-Dimethylphenyl)pyrrole-2,5-dione (Formula: C12H11NO2, MW: 201.22). The listed precursor masses (325.035, 329.029, 649.062, 671.044 in positive mode) were inconsistent with common adducts of either molecule. The fact that 4,849 spectra were removed during this step highlights the importance of automated structural and mass validation of public libraries.
Annotation Rates
Removing 34% of library spectra will affect overall annotation rates. To assess this impact, we analyzed four datasets spanning diverse sample types—human, fish, plant, and bacteria—using three sets of libraries: the original pre-cleaned libraries, the cleaned libraries, and the cleaned and merged libraries. Across all datasets, the pre-cleaned libraries produced the highest annotation rates, followed by the cleaned libraries, and then the cleaned and merged libraries.
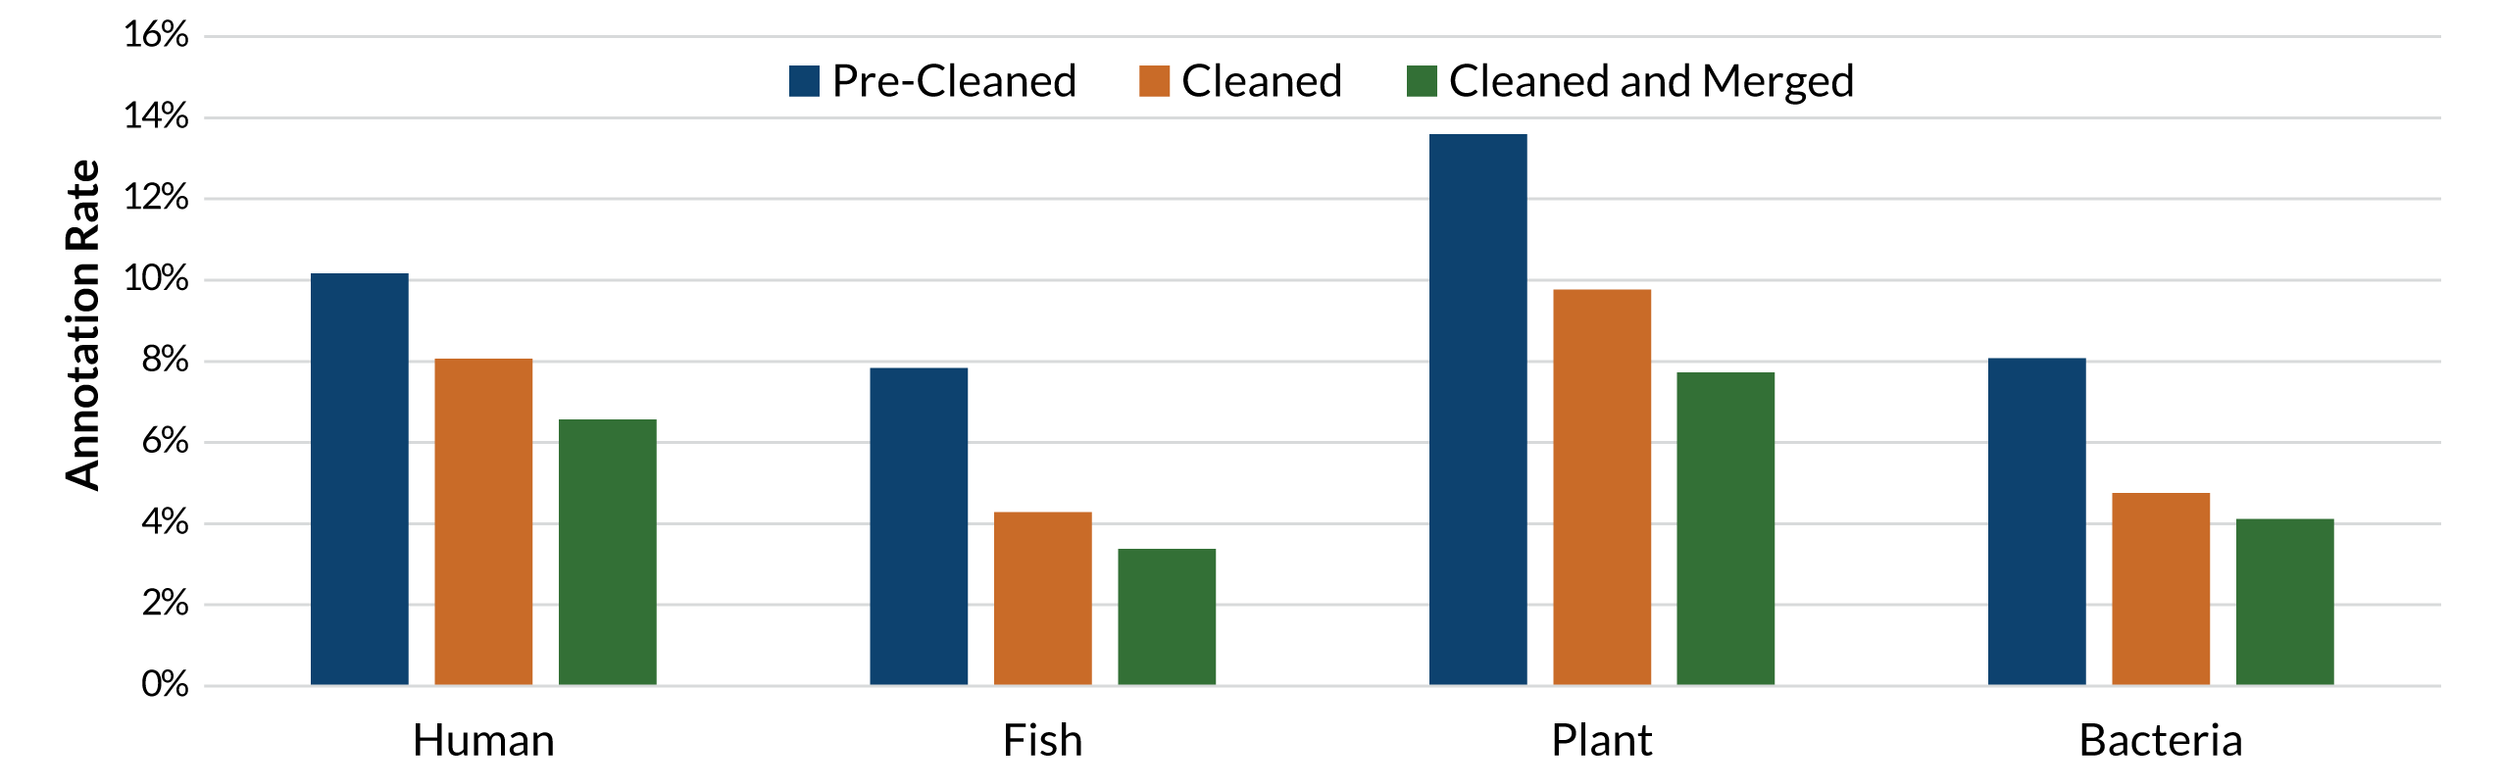
Of course, annotation rate does not reflect annotation accuracy. Additional matches from the pre-cleaned libraries could be the result of inaccurate library spectra. For instance, of the 2207 unique library matches to the pre-cleaned libraries, 10 were flagged during the mass validation step (Step 6), 46 were flagged as low resolution (Step 2), and 195 were flagged for having no valid structural information (Step 5). Together, these represent 11% of the total matches to the pre-cleaned libraries. Thus, while the cleaning workflow reduces the total number of matches, it increases confidence in those that remain.
Merging Results
Although 616,078 spectra passed all cleaning steps, many of these represented repeated measurements of the same compound-adduct pair. After merging spectra belonging to the same adduct of a compound, the library was reduced to 107,066 unique adduct entries. Accounting for multiple adducts per compound, this corresponds to 57,366 unique compounds in the cleaned libraries.
While the most common number of spectra per adduct was 1 or 2, each adduct was observed an average of 5.7 times. The most frequently observed adduct was the M+H adduct of (2S)-2-(dodecanoylamino)propanoic acid, which appeared 460 times. This level of redundancy illustrates both the strength and inefficiency of large public libraries. Multiple spectra collected under different experimental conditions can strengthen reference quality; however, the repeated addition of well-represented compounds suggests that expanding coverage of new chemical space should be prioritized over further replication of common molecules.
The M+H adduct dominated adduct distribution, accounting for 45% of entries (48,249 spectra), followed by M–H at 21% and M+Na at 9%. Each compound was represented by an average of 1.8 adducts. Cholic acid exhibited the greatest adduct diversity, appearing as 14 distinct adducts.
Propagated libraries
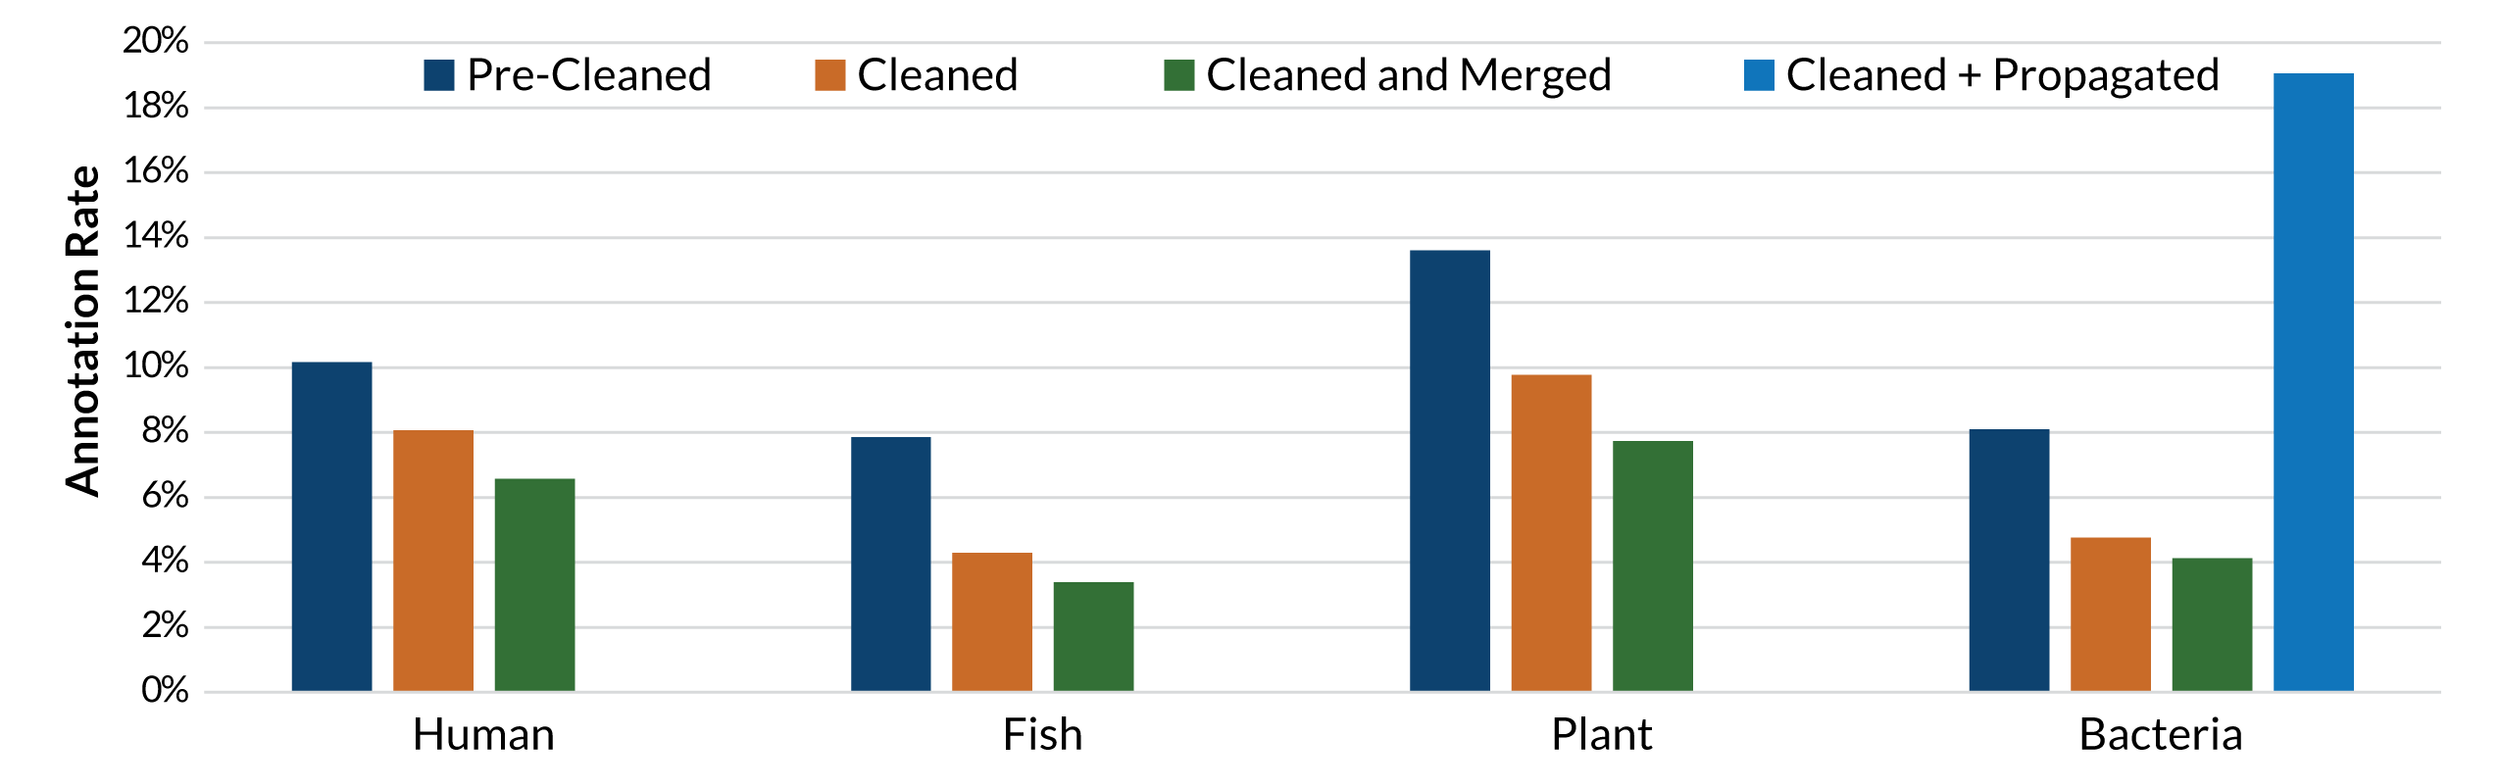
An entire class of spectral libraries—propagated libraries—was intentionally excluded from this analysis. Unlike traditional reference libraries generated from purified standards, propagated libraries are derived from high-throughput synthesis workflows or computational mining of public datasets. Because many of these entries have not been verified, they were not subjected to the same structural validation pipeline.
However, propagated libraries can still provide useful insights. When the bacterial dataset was re-analyzed using the cleaned and propagated libraries, the annotation rate increased from 5% to 19%. This substantial increase highlights how propagated libraries can expand chemical coverage, particularly in underrepresented compound classes, when used alongside rigorously curated reference libraries.
Summary
Here, we present a scalable, automated spectral library cleaning pipeline capable of validating structural information, mass, adduct assignment, and metadata across nearly one million spectra. When applied to 75 spectral libraries comprising 928,631 spectra, the workflow removed 34% of entries and reduced 616,078 validated spectra to 107,066 unique compound-adduct pairs after merging.
Although stricter curation lowers nominal annotation rates, it substantially improves annotation validity. By transforming library cleaning from a static, one-time effort into a repeatable and tunable process, this pipeline enables continuous quality control as community libraries expand. The result is more reliable spectral matching, improved reproducibility across studies, and greater confidence in small molecule annotations.
The cleaned libraries created by this pipeline are now available in Ometa Flow and will be periodically updated to include new library entries. In addition, clients can request access to the workflow to perform their own cleaning of public or private libraries.
Limitations
There are many possible approaches to library validation and curation. The thresholds and validation rules used here may not be optimal for every dataset or application. The workflow was designed to minimize false positives at the expense of false negatives; thus, many of the removed spectra may be accurate but lack sufficient metadata for automated verification. Of course, it is still possible that the pipeline did not flag all inaccuracies. For instance, a spectrum with the correct mass and structural information for one compound and MS2 peaks from a different compound would pass all the validation steps described above.
Finally, reliance on external resources such as PubChem for compound name verification means that compounds not yet deposited in these databases may be excluded. Approximately 11% (34,852) of removed spectra were filtered during Step 8, primarily because their PubChem metadata was missing or incomplete. As these resources continue to expand, we expect that many spectra excluded during this step will eventually be re-introduced to the cleaned library.
Have more questions? Contact us.
This research was supported by the National Institute of General Medical Sciences of the National Institutes of Health under award number 1R44GM162107. The content is solely the responsibility of the authors and does not necessarily represent the official views of the National Institutes of Health.