
Flavonoid identification with MassQL
Flavonoids are a diverse group of polyphenolic compounds found in plants. They have potent antioxidant properties and are responsible for the color, fragrance, and flavor of many fruits and vegetables. They play crucial roles in plant metabolism: regulating cell growth, increasing tolerance to drought, heat, and freezing, and scavenging reactive oxygen species (ROS).1,2 Flavonoids may also play important roles in human health as their biological activities - including anti-inflammatory, anticancer, anti-aging, antidiabetic, antiviral, and neuroprotective effects - could lead to novel therapeutics.3
While certain flavonoids are well studied, compounds such as quercetin, catechin, naringenin, and cyandin are a small part of a very large chemical family. Current estimates place the total number of flavonoids between 6,000-10,000, although that number tends to grow year over year.1-3 Many of these compounds have never been purified or structurally elucidated, making them difficult to identify using traditional library annotation. However, flavonoids do share a basic chemical skeleton. This shared structure can produce diagnostic MS2 peaks that are common across diverse classes of flavonoids. In this application note, we highlight how the Mass Spec Query Language (MassQL) paired with molecular networking can rapidly identify novel flavonoids in MS/MS data. You can also walk through each of these steps in our accompanying video tutorial.

Step One: Molecular Networking
While MassQL can be run as a standalone workflow, its results are most informative when paired with molecular networking. Molecular networks map compounds by their structural similarity, providing crucial structural information for compounds that aren’t annotated using traditional library matching. For detailed information on how to run molecular networking in Ometa Flow, please refer to this video tutorial. The molecular network for this application note contains MS/MS data from four plant species (MSV000094217). Results can be accessed here.

Library matches to flavonoids in the molecular network. Results can be accessed here.
The library identifications table above shows that several known flavonoids have already been identified in the molecular network by library matching. As expected, many of these known flavonoids network together. For instance, the sub-network below containing naringin also contains matches to apigenin, hyperoside, isorhamnetin, kaempferol, rutin, and tiliroside, as well as several unknown compounds. These unknown compounds should share significant structural similarity with known flavonoids and are already excellent candidates for further compound identification.

Sub-networking containing naringin and several other known flavonoids. Each circle (node) corresponds to a unique metabolite. Blue nodes have library matches while gray nodes indicate unknown compounds. This visualization can be accessed here.
Step Two: MassQL
Molecular networking has already identified several novel flavonoid candidates, but it may not have identified all of them (see limitations below). To provide a more comprehensive list of potential flavonoids, we can use MassQL to search for diagnostic MS2 fragments. While there is no single diagnostic MS2 peak that will consistently identify all flavonoids, there are a handful of peaks that can cover a large range of flavonoid classes. This example searches for the quercetin core fragment along with two common flavonoid product ions.4,5
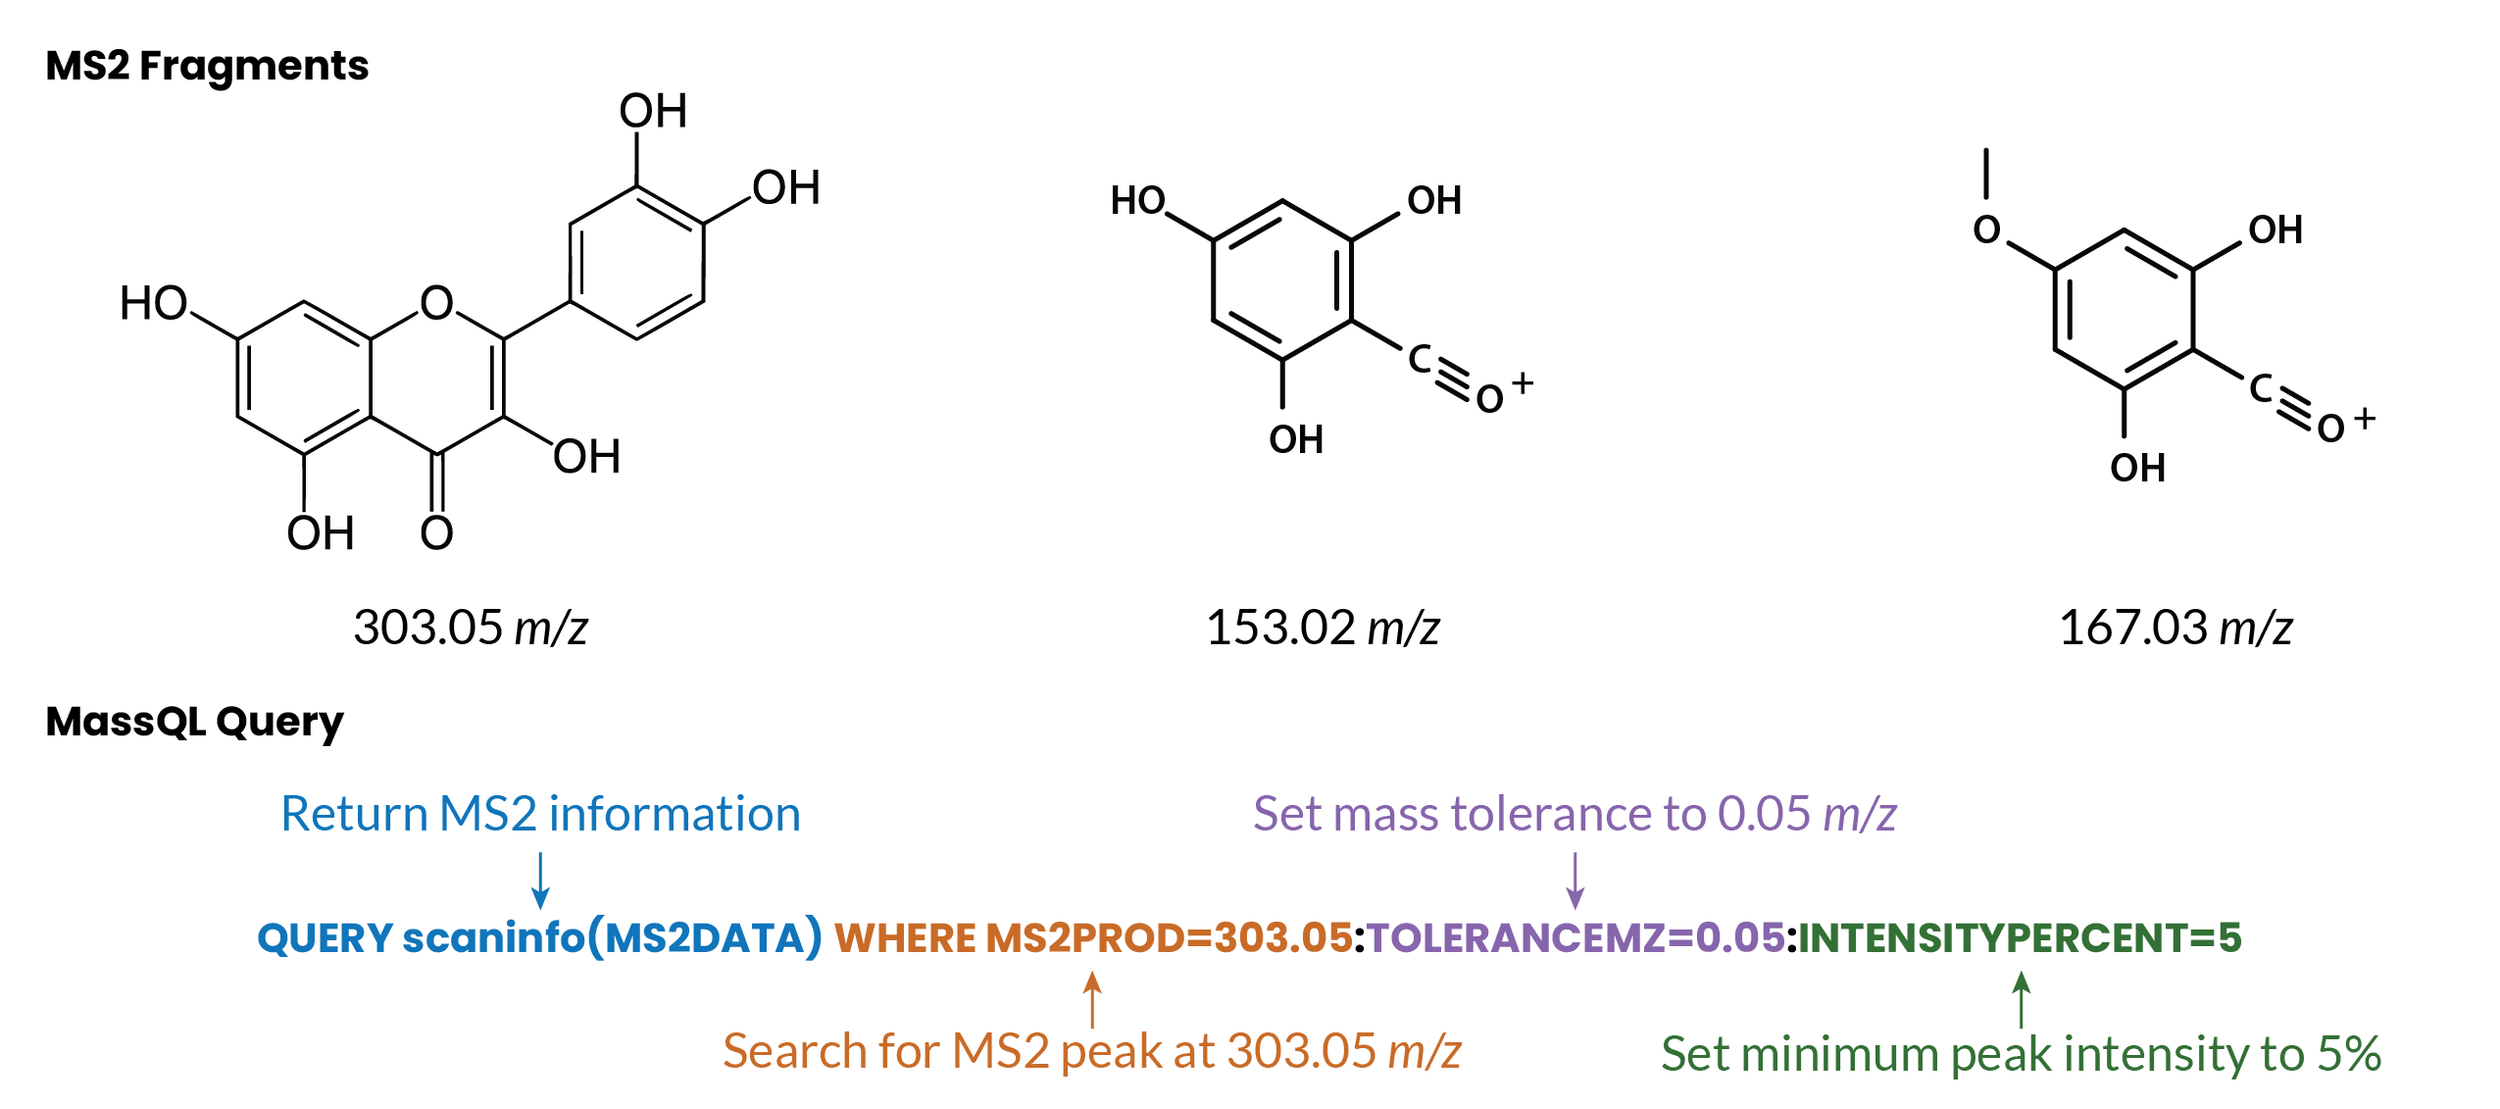
The massQL queries are:
QUERY scaninfo(MS2DATA) WHERE MS2PROD=303.05:TOLERANCEMZ=0.05:INTENSITYPERCENT=5|||
QUERY scaninfo(MS2DATA) WHERE MS2PROD=153.02:TOLERANCEMZ=0.05:INTENSITYPERCENT=5|||
QUERY scaninfo(MS2DATA) WHERE MS2PROD=167.03:TOLERANCEMZ=0.05:INTENSITYPERCENT=5
These queries search for MS2 peaks at 303.05, 153.02, and 167.03 m/z* with a mass tolerance of 0.05 m/z and a minimum peak intensity of 5%.** For more information on how to construct a MassQL query, consult our MassQL blog or video tutorial. For now, note that changing a query to match your favorite flavonoid fragment of interest is as simple as changing the value after MSPROD=. For instance, a search for kaempferol at 287.055 m/z would be:
QUERY scaninfo(MS2DATA) WHERE MS2PROD=287.055:TOLERANCEMZ=0.05:INTENSITYPERCENT=5
MassQL can also be used to search for MS1 peaks, neutral losses, retention times, charges, peak intensity ratios, and many other spectral features.6
The queries above identified 49 spectra that matched at least one of the specified MS2 peaks in 43 seconds.*** MassQL matches can then be overlaid on a molecular network to provide even more rich information on novel flavonoid candidates. Results can be accessed here.

Molecular network highlighting nodes containing MS2 peak at 303.05 m/z. Visualization can be accessed here.
The nodes highlighted above contain the MS2 peak at 303.05 m/z which corresponds to the quercetin core. While many of these nodes network together, there are some unknown metabolites containing this MS2 peak that would not have been identified in the original molecular network. Nodes matching the other MassQL queries showed some overlap but also identified further unknown metabolites that may share the flavonoid core structure.
Summary
The steps above outline how to rapidly identify entire classes of plant metabolites using molecular networking and MassQL. The process took MS/MS data with no pre-processing and performed spectral clustering, peak integration, library matching, molecular networking, and identification of 49 potential flavonoids in less than 15 minutes.*** For even faster results, a standalone MassQL analysis of the same MS/MS files without molecular networking completed in less than 2 minutes. These analyses can accelerate natural products discovery and generate new lead compounds and are flexible enough to be used in a wide variety of applications.
Limitations
While molecular networking can rapidly map structural similarity in a sample, it does not perfectly predict which metabolites are structurally related. For instance, the cosine score used in the molecular network above uses MS2 spectral similarity as a proxy for structural similarity. This score is excellent at linking closely-related structures, but can fail when structures have multiple modifications. To alleviate this issue, we provide multiple scoring algorithms for molecular networking that can provide more comprehensive linkage information. In addition, networking settings can influence whether two compounds are linked in a network. We provide default settings that work well for most applications, but are always happy to discuss how these may influence results. In addition, all analysis tasks in Ometa Flow are uniquely indexed with their exact inputs and settings, making it easy to find appropriate settings and replicate previous analyses.
Finally, MassQL will only find the spectra that match your search parameters. If a novel flavonoid does not contain the MS2 peak in question, it will not be found using this tool. Search parameters can be adjusted using different mass tolerances (TOLERANCEMZ) or minimum intensity values (INTENSITYPERCENT) and it is always advisable to test and refine MassQL queries to best match your input data and application.
Have more questions? Contact us.
*m/z values are from data collected in positive mode. This doesn’t necessarily mean they won’t show up in negative mode data, but it’s always worth keeping in mind. In our research for this application note, we have been told by people in the know that certain flavonoids fragment much better in negative mode (thanks Fausto!). Check out this paper for more information.
**The ||| shown in these queries tells the algorithm to search for each MS2 peak and return results separately. To search for all three peaks simultaneously, the searches could be combined with AND (eg, MS2PROD=303.05:TOLERANCEMZ=0.05:INTENSITYPERCENT=5 AND MS2PROD=153.02:TOLERANCEMZ=0.05:INTENSITYPERCENT=5)
**Analyses were run on a local server with 20 Cores and 480GB RAM. Runtimes can be significantly improved by increasing computational resources or migrating to high performance computing (HPC).
References
1. Dias, M. C., Pinto, D. C. G. A. & Silva, A. M. S. Plant Flavonoids: Chemical Characteristics and Biological Activity. Molecules 26, 5377 (2021).
2. Panche, A. N., Diwan, A. D. & Chandra, S. R. Flavonoids: an overview. J. Nutr. Sci. 5, e47 (2016).
3. Ullah, A. et al. Important Flavonoids and Their Role as a Therapeutic Agent. Molecules 25, 5243 (2020).
4. Jiang, C. & Gates, P. J. Systematic Characterisation of the Fragmentation of Flavonoids Using High-Resolution Accurate Mass Electrospray Tandem Mass Spectrometry. Molecules 29, 5246 (2024).
5. Scigelova, M., Hornshaw, M., Giannakopulos, A. & Makarov, A. Fourier Transform Mass Spectrometry. Mol. Cell. Proteomics MCP 10, M111.009431 (2011).
6. Jarmusch, A. K. et al. A Universal Language for Finding Mass Spectrometry Data Patterns. 2022.08.06.503000 Preprint at https://doi.org/10.1101/2022.08.06.503000 (2022).
7. Alves, M. F. et al. LC-MS/DIA-based strategy for comprehensive flavonoid profiling: an Ocotea spp. applicability case. RSC Adv. 14, 10481–10498.
Acknowledgements
Thanks to Dr. Helena Mannochio Russo who generated the data used in this tutorial (MSV000094217). Thanks to Dr. Fausto Carnevale Neto for sharing his knowledge of flavonoid structures.