
Molecular Networking for Metabolite Identification (MetID)
Understanding how a drug is modified in the human body is crucial for assessing its safety and efficacy. Every new drug candidate must undergo metabolite identification (MetID) studies to determine which metabolites are formed and how they affect the absorption, distribution, metabolism, and excretion (ADME) and pharmacokinetic/pharmacodynamic (PK/PD) parameters of the drug.1
Most MetID studies focus on the handful of metabolic transformations that occur during Phase 1 metabolism and are performed by known human enzymes (mainly CYPs).2 However, Phase 1 metabolism is only the tip of the iceberg when it comes to the biotransformations that can occur in the human body. For instance, the gut microbiome encodes 150 times more genes than our human genome, including many enzymes capable of unique metabolism.3 These enzymes can both directly metabolize drugs and modify the activity of human metabolic enzymes.4–6 Failing to identify these metabolites during preliminary safety testing can lead to delays in development or unexpected toxicity in human trials.
But how can one identify drug metabolites if their biotransformation pathways are unknown? This is where untargeted metabolomics and molecular networking shine.7 Unlike a targeted analysis, where each drug metabolite must be known in advance, untargeted metabolomics measures all metabolites in a sample. When paired with the ability of molecular networking to rapidly identify structurally-related compounds, this technique can uncover a wide range of drug metabolites formed by both traditional and novel biotransformations. The following tutorial walks through the steps to determine the drug transformations of eight common medications using the Ometa Flow platform and is accompanied by a detailed video tutorial.
Step One: Library Creation
The first step in identifying drug metabolites is to identify the parent drug. This is generally done by creating a MS/MS library containing the parent drug(s). Ometa Flow’s extensive spectral libraries house over 3 million spectra collected from the public repositories GNPS, MassBank, and MoNA. But on the off chance your parent drug isn’t included in this library (or you want to recollect library standards on your instrument), Ometa offers a high-throughput library building tool called MSMS-Chooser.
Traditionally, once you had collected MS2 data from your parent drug, you would need to manually search for your library spectra. This would need to be done for every compound (and compound adduct) under investigation. MSMS-Chooser automates this process by searching for library compounds and their adducts and returning results in an easy-to-use format. In this example, library spectra are extracted from a single MS/MS sample containing eight common medications: abacavir, darunavir, losartan, quetiapine, ritonavir, sertraline, sulfasalazine, and venlafaxine. Users must only upload their MS/MS data and a table with the name and SMILES ID* for each compound of interest.
The workflow identified 26 spectra corresponding to the compounds and their adducts in 15 seconds.** Results can be viewed here. The Status Summary table confirms that the workflow identified the most common adduct (M+H) for each of the eight compounds. The Annotations Found Summary then lists out every adduct found by the workflow. If an incorrect spectrum is identified, it can be deleted from the table and removed from downstream libraries. Once results have been verified, the spectra can be added to spectral libraries with the Add to Libraries button.

Results from high-throughput library generation with MSMS-Chooser. Results can be accessed here.
Step Two: Molecular Networking
Once the appropriate spectral libraries have been created, they can be used to identify drugs and their metabolites using Molecular Networking. Here, the eight drugs from the previous step were incubated with synthetic microbial communities for 72 hours to identify potential microbial metabolites (MSV000095331). Samples include blanks (n=6) as well as the bacteria+medications at the beginning of the experiment (T0, n=30) and after a 72 hour incubation (T72, n=30). The Ometa Flow molecular networking workflow performed library searching, molecular networking, and peak integration on these files in 20 minutes.** Results can be viewed here. The Library Identifications table indicates that the workflow found 18 of the 26 spectra identified in Step 1. The Networking Browser (which can be accessed using the Visualize Network in Browser button) provides additional information on unknown compounds that are structurally related to these medications. In molecular networking, structurally related compounds are organized into subnetworks. Each node (or circle) in the subnetwork corresponds to an individual compound, and edges between compounds indicate spectral (and thus structural) similarity. Several of the spectra corresponding to the eight medications networked with unknown compounds that could be potential drug metabolites. For instance, Ritonavir, Abacavir, and Quetiapine all networked with 4-5 unknown compounds. Similarities between these compounds can be investigated by clicking on the edge between two nodes to compare spectra or overlaying mass differences (delta m/z) between compounds on the network edges. To quickly visualize which compounds were identified in which samples, the Show Pie Charts function can draw pie charts for each node with their abundance in each sample group. For instance, these pie charts indicate that while Ritonavir is mostly found at T0, some of its structurally related compounds are mostly found at T72.
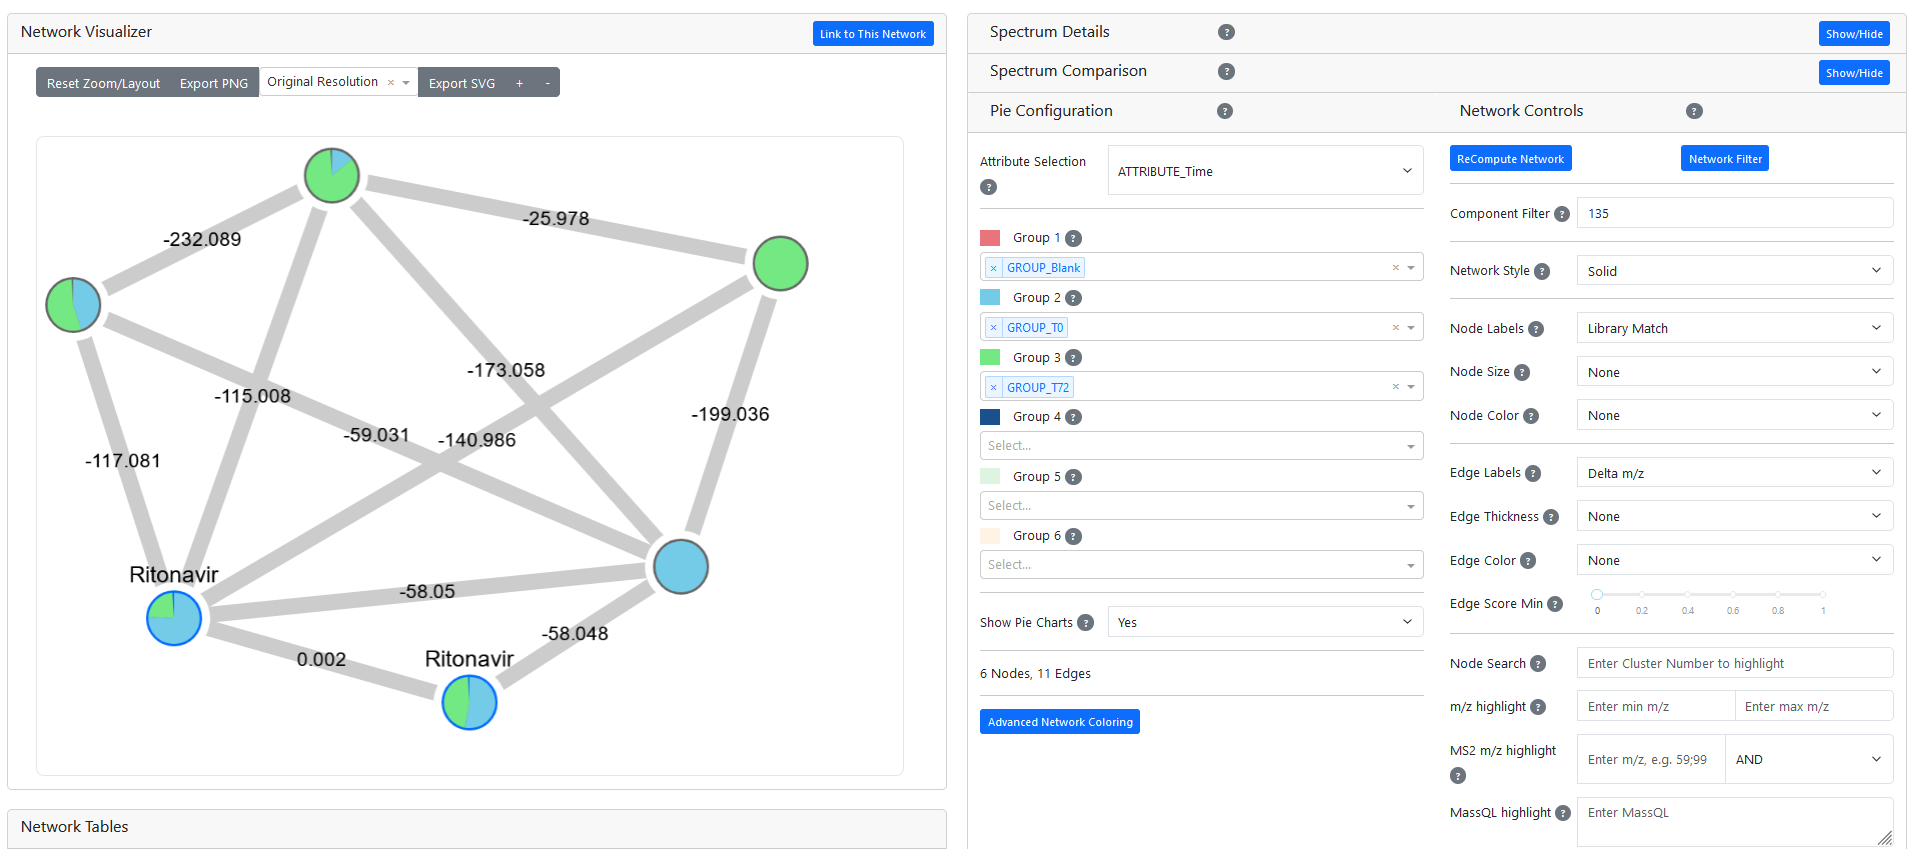
Networking dashboard showing subnetwork containing Ritonavir. Metabolites identified at Time 0 are colored in blue, those identified at Time 72 are in green. The mass difference (delta m/z) between each metabolite is displayed over network edges. This visualization can be accessed here. Full results available here.
Step Three: Statistics
While molecular networking can provide a qualitative analysis of which metabolites are upregulated in certain groups, our Statistics Processing workflow provides an in-depth analysis of differentially regulated metabolites. This workflow performs blank subtraction, data cleaning and normalization, and several statistical tests and provides interactive visualizations and completed analysis of the >60 files from the previous step in less than 5 minutes.** Results can be viewed here. The All Statistics table provides an overview of important differentially regulated metabolites. Unsurprisingly, many metabolites are up- and downregulated after a 72 hour microbial incubation. To focus on metabolites of interest, you can filter results by the subnetworks (also called components) containing the known medications. For example, the visualization below shows a volcano plot comparing Time 0 to Time 72. Filtering by the subnetwork containing Ritonavir (Component 135) allows the user to rapidly highlight the compound of interest and draw a boxplot of its expression in each group. This unknown metabolite is both structurally related to Ritonavir and is upregulated after a 72 hour microbial incubation, making it an excellent candidate microbial drug metabolite. The mass difference between these two compounds is 140.986 m/z, which likely corresponds to the release of 5-(hydroxymethyl)-thiazole.8***

Volcano plot comparing metabolites from Time 0 and Time 72. The highlighted metabolite networks with Ritonavir and is upregulated after a 72 hour microbial incubation. Results can be accessed here.
Summary
The steps described above can rapidly identify novel drugs and their metabolites without prior knowledge of all potential biotransformations. Our example process took over 60 raw MS/MS files from library creation, library searching, molecular networking, and statistical analysis in less than 30 minutes of total computation time.** While this process cannot replace all targeted ADME and PK/PD studies (see limitations below), it can accelerate and inform downstream studies and identify important metabolites that would not be found in more traditional MetID analyses.
Limitations
Untargeted metabolomics can only provide relative quantification of metabolites. Many ADME and PK/PD studies require targeted analyses to provide absolute quantification of metabolites of interest. The technique described above is best used as a screening tool to identify potential drug metabolites and should be followed by quantitative studies.
In addition, certain metabolites are unstable or are only produced under specific conditions. If a metabolite doesn’t exist or isn’t measured in your sample, it will not be identified using this technique. This limitation applies to both untargeted and targeted analysis. To measure the widest range of possible drug metabolites, it can be helpful to periodically re-run screens under different experimental conditions in order to identify metabolites that may not have been measured during initial screening.
Finally, the cosine scoring metric used to generate the network in this example draws edges based on similarity between MS2 spectra. If a biotransformation significantly changes the MS2 spectrum of a drug metabolite, it may not network with its parent drug. To address this issue, Ometa Flow offers additional scoring algorithms including Spec2Vec and MS2DeepScore that can identify structurally-related compounds that may have been missed by cosine scoring.9,10 Comparing results from these algorithms can provide a more complete picture of all potential drug metabolites.
Have more questions? Contact us.
*If you don’t have a SMILES for your compound, you can also use m/z, chemical formula, or even molecular mass to identify your compounds of interest.
**Analyses run on a local server with 20 Cores and 480GB RAM. Runtimes can be significantly improved by increasing computational resources or migrating to high performance computing (HPC).
***This metabolite likely corresponds to metabolite M7 in the referenced publication.
References
1. FDA. Safety Testing of Drug Metabolites: Guidance for Industry. (2020).
2. Zhao, M. et al. Cytochrome P450 Enzymes and Drug Metabolism in Humans. Int. J. Mol. Sci. 22, 12808 (2021).
3. Zhu, B., Wang, X. & Li, L. Human gut microbiome: the second genome of human body. Protein Cell 1, 718–725 (2010).
4. Björkholm, B. et al. Intestinal Microbiota Regulate Xenobiotic Metabolism in the Liver. PLoS ONE 4, e6958 (2009).
5. Enright, E. F., Gahan, C. G. M., Joyce, S. A. & Griffin, B. T. The Impact of the Gut Microbiota on Drug Metabolism and Clinical Outcome. Yale J. Biol. Med. 89, 375–382 (2016).
6. Lucchetti, M., Kaminska, M., Oluwasegun, A. K., Mosig, A. S. & Wilmes, P. Emulating the gut–liver axis: Dissecting the microbiome’s effect on drug metabolism using multiorgan-on-chip models. Curr. Opin. Endocr. Metab. Res. 18, 94–101 (2021).
7. Thomas, S. P. et al. Transfer of antibiotics and their metabolites in human milk: Implications for infant health and microbiota. Pharmacotherapy 43, 442–451 (2023).
8. Li, F., Lu, J. & Ma, X. Metabolomic screening and identification of bioactivation pathways of ritonavir. Chem. Res. Toxicol. 24, 2109–2114 (2011).
9. Huber, F. et al. Spec2Vec: Improved mass spectral similarity scoring through learning of structural relationships. PLOS Comput. Biol. 17, e1008724 (2021).
10. Huber, F., van der Burg, S., van der Hooft, J. J. J. & Ridder, L. MS2DeepScore: a novel deep learning similarity measure to compare tandem mass spectra. J. Cheminformatics 13, 84 (2021).
Acknowledgements
Special thanks to Drs. Haoqi (Nina) Zhao and Vincent Lamoureux who collected the data used in this tutorial (MSV000095331).