
Quality control (QC) is essential to creating safe and effective products. QC must be performed over the course of a product’s lifecycle to ensure that 1) the product contains what it is supposed to contain and 2) does not contain any dangerous or unwanted byproducts.
Targeted Analysis for QC
While QC can take many forms, one common method is targeted metabolomics. Targeted metabolomics uses mass spectrometry to measure the mass and retention time of compounds of interest and can be rapid, reliable, and cost-effective.1,2 However, performing targeted analyses alone can limit the effectiveness of your QC.
Problem One: Batch Analysis
An ideal QC method would take samples from every factory, processing plant, and manufacturing line and perform a single analysis to identify contaminants and pinpoint potential sources of contamination. This analysis could be re-run over time to understand how fluctuations in source material or manufacturing practices affect the final product. This may be possible if your QC is being performed on a single instrument in a single location (although you’ll still need to make sure whoever is running that instrument knows what they’re doing). However, it becomes a much bigger issue for large productions.
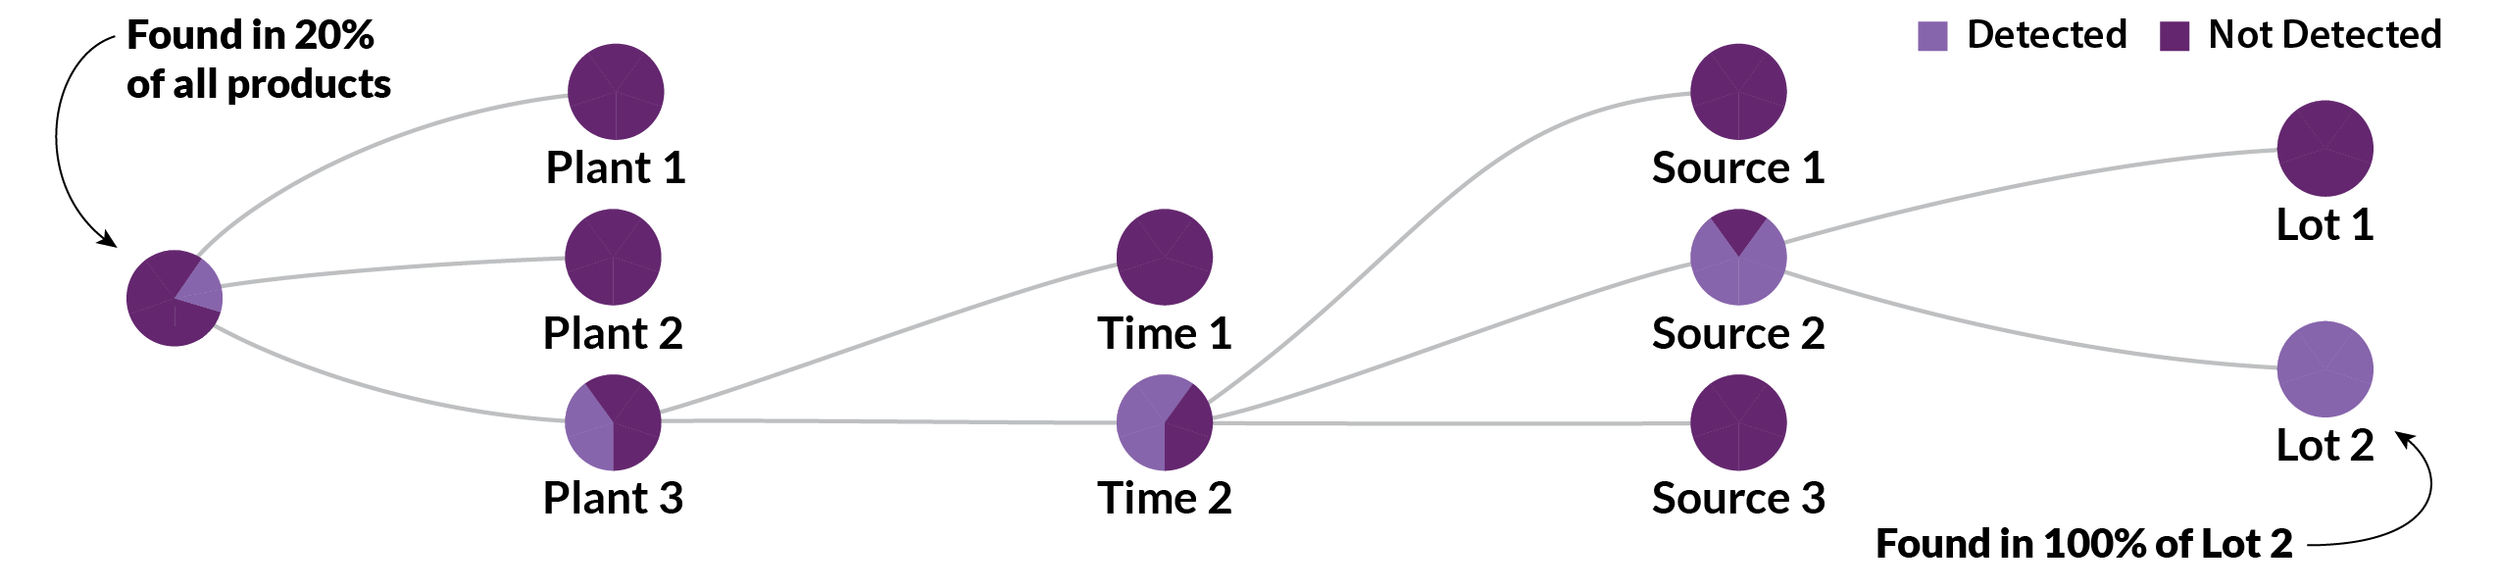
Example of QC workflow comparing samples across manufacturing plants, time, and source material to identify contaminants and trace their origin.
Why? Most targeted analyses are MS1 only. MS1 measures the overall mass and retention time of the compounds in a sample: providing two data points for identifying compounds of interest. While the overall mass should remain consistent in a well-maintained instrument, retention time likely will not. Retention time is notoriously unstable and will drift across instruments, experimental conditions, column conditions, room temperatures, and even times of day. While there are ways to correct for retention time drift, the best method to ensure you are measuring the right compound is to always* run internal standards alongside experimental samples.3,4
Generally, this means that each batch of samples must be analyzed separately to ensure that retention time drift does not affect detection of the target compound. While results from these individual analyses can be compared after the fact, changes to analytical workflows, experimental parameters, or staffing can greatly hinder inter-batch comparisons.
Problem Two: Target Blindness
It is possible to run the perfect targeted experiment with ideal instrumental conditions and the slimmest of retention time drifts and still miss important byproducts. This is because most targeted analyses determine target compounds in advance. Ideally, those target compounds are then purified and added to samples as internal standards before performing instrumental analysis. If a new contaminant or degradation product is introduced, it won’t be measured or flagged by this process.
Even if target compounds aren’t determined in advance, MS1-only analysis provides very little information on the possible chemical composition of potential contaminants. The overall mass of a compound and its isotopic envelope can be used to predict its chemical formula, but there can be hundreds to thousands of compounds that share the same chemical formula. While retention time can provide extra information on the chemical properties of the compound, elucidating the structure of an unknown contaminant can take months or years.
Untargeted Analysis for QC
Thankfully, there is an unbiased way to perform QC that doesn’t rely on retention time for compound identification. Untargeted metabolomics uses tandem mass spectrometry (MS/MS) to identify metabolites based on their chemical substructures.5 Unlike MS1-only (MS) analysis, MS/MS measures the mass of the overall compound (also called the precursor mass) and substructures within that compound. It does so by breaking each compound into fragments and then running another round of mass spectrometry to measure fragment masses. This process provides a chemical barcode for the compound of interest that can be used in conjunction with precursor mass and retention time to identify compounds. MS2 spectra often contain dozens of peaks, greatly expanding the number of data points that can be used for compound identification and structural elucidation.

While MS2 spectra can vary across instruments and experimental conditions, they tend to be much more stable than retention time and provide additional information on a compound’s internal structure. Thus, MS/MS data can be used to perform meta-analyses that could not be performed using MS1 alone. In addition, untargeted analyses do not determine target analytes in advance, providing an unbiased overview of potential contaminants in a sample.
The following application note demonstrates how to rapidly perform untargeted QC analysis in Ometa Flow.
Step One: Molecular Networking
Ometa’s molecular networking workflow combines spectral clustering, compound identification, and molecular networking and can be run directly from raw mass spectrometry data. This application note uses data collected from the NIST Seafood Reference material for wild-caught and aquacultured salmon (RM 8256 and RM 8257, Dataset: MSV000092716). The wild-caught and aquacultured samples were split into two groups to represent distinct sources that could be incorporated into a final product and were analyzed alongside blank samples (n=4 per group).
Molecular networking identified 3,315 metabolites in these samples in approximately 20 minutes.** Of these, 704 (21%) could be identified using spectral library matching. Results can be accessed here. While less than 25% of these metabolites were annotated using library matching, molecular networking can expand these annotations by grouping known and unknown compounds based on their similarity. In Ometa Flow, there are several methods for performing these calculations. This analysis used the machine learning model MS2DeepScore, which leverages known structural information to link molecules according to their structural similarity.6 For instance, the following figure shows a compound identified as ubidecarenone (coenzyme Q10) connected to an unannotated metabolite. These two compounds share strong spectral similarity, but one is upregulated in aquacultured salmon while the other is upregulated in wild-caught salmon.

Sub-networking containing ubidecarenone and unknown compounds. Each circle (node) corresponds to a unique metabolite. This visualization can be accessed here.
This type of analysis provides a comprehensive survey of the compounds in a sample and can rapidly identify degradation products of a target compound. To do so, spectral libraries are used to identify key chemical components in a product. Networking then highlights structurally-related compounds, which frequently include degradation products or other metabolites of the target molecules.
Step Two: Statistical Analysis
While the visualizations above offer qualitative insights into the metabolites present in each batch, statistical analysis can provide a more quantitative approach. Statistical analysis can be run directly from molecular networking in Ometa Flow and performs normalization, blank subtraction, and a slate of statistical tests.
Statistical analysis of this dataset identified hundreds of metabolites that were differentially regulated between wild-caught and aquacultured salmon. This included the molecule spermine, which was present in significantly higher concentrations in wild-caught compared to aquacultured salmon. Results can be accessed here.
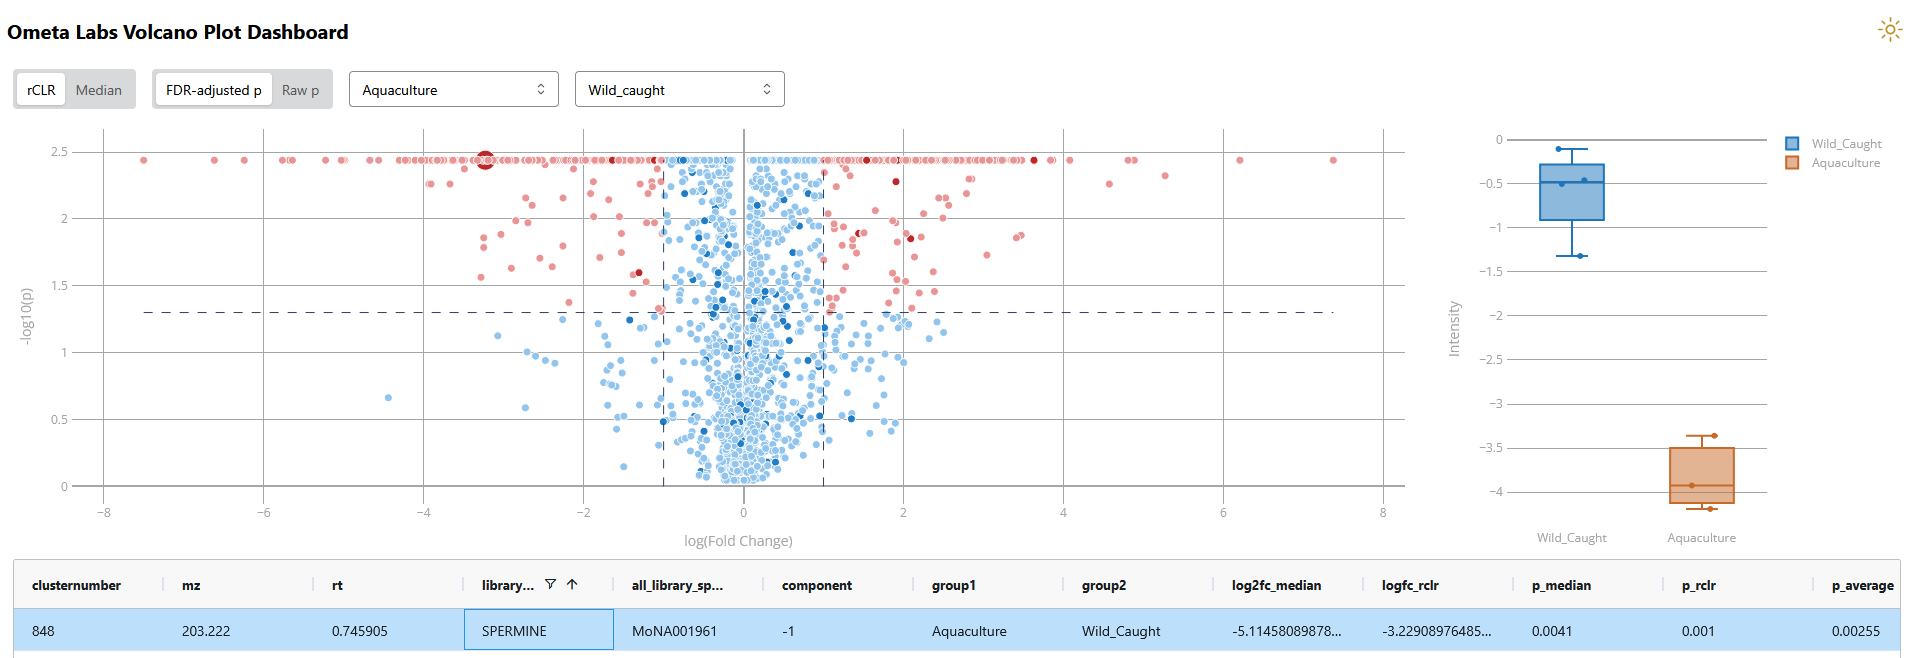
Volcano plot showing upregulation of spermine in wild caught salmon. Visualization can be accessed here.
Principal components (PCA) analysis also showed separation between wild-caught and aquacultured salmon. PCA analysis can be used to rapidly compare batches and assess which metabolites are contributing to inter-batch differences.

Bioplot showing separation between wild-caught and aquacultured salmon. Spermine is associated with wild-caught salmon. Visualization can be accessed here.
Step Three: Source Tracking
Identifying potential contaminants and understanding their relative abundance in different batches are crucial steps in quality control. However, the question remains - where did these contaminants come from?
MASST offers a rapid solution by searching for a compound across an entire database of MS/MS files, returning every file where a matching compound has been detected.7,8 For instance, the spectrum identified as spermine was found over 24,000 times in Ometa's domainMASST repository, which currently contains over 330,000 MS/MS files. While searches to public repositories can be useful, the true power of MASST in QC is realized using custom MASST databases. These databases can be built using proprietary data organized based on your company's priorities. For instance, this tree shows the detection of spermine across a custom database that organizes samples by factory, time of year, and source material.***
Custom MASST databases allow users to efficiently trace where a particular contaminant has been detected throughout the manufacturing process, providing valuable insights into potential sources of contamination.
Summary
This application note highlights the power of untargeted metabolomics for quality control. The workflow described above took MS/MS files and performed spectral clustering, library annotation, peak integration, molecular networking, normalization, blank subtraction, statistical analysis and source tracking in less than 30 minutes.** This process provides an unbiased analysis of potential contaminants in sample batches and can pinpoint potential sources of contamination.
Limitations
While MS2 analyses are more consistent and data-rich than MS1-only analyses, differences in experimental parameters can affect MS2 fragmentation. Thus, meta-analyses using MS2 will not perfectly capture the same metabolite across every instrument or experimental method. If you are planning to regularly perform meta-analyses across sites, we recommend standardizing experimental protocols to ensure consistent MS2 fragmentation.
In addition, untargeted analysis can only provide relative quantification of your compounds. If absolute quantitation is required, it is best to use untargeted analyses as a discovery tool to inform quantitative targeted analysis.
Have more questions? Contact us.
*Always means always! The best method here is to add an isotopically-labeled internal standard to all your samples. If that’s not possible, run internal standards regularly throughout your run. I can’t tell you how many times I’ve seen people claim to have identified a compound because its overall mass and retention time matched to a compound someone measured years ago in a different lab. Even if that compound was measured last month in the same lab, there is no guarantee that annotation is correct, especially when analyzing complex biological samples.
**Analyses were run on a local server with 20 Cores and 480GB RAM. Runtimes can be significantly improved by increasing computational resources or migrating to high performance computing (HPC).
***Metadata was created for the purposes of demonstration and does not reflect actual sample origin.
References
1. Lee, K.-M., Jeon, J.-Y., Lee, B.-J., Lee, H. & Choi, H.-K. Application of Metabolomics to Quality Control of Natural Product Derived Medicines. Biomol. Ther. 25, 559–568 (2017).
2. Cevallos-Cevallos, J. M., Reyes-De-Corcuera, J. I., Etxeberria, E., Danyluk, M. D. & Rodrick, G. E. Metabolomic analysis in food science: a review. Trends Food Sci. Technol. 20, 557–566 (2009).
3. US Food and Drug Administration (FDA) Center for Drug Evaluation and Research (CDER). Bioanalytical Method Validation Guidance for Industry. (2020).
4. Broadhurst, D. et al. Guidelines and considerations for the use of system suitability and quality control samples in mass spectrometry assays applied in untargeted clinical metabolomic studies. Metabolomics 14, 72 (2018).
5. Tian, Z., Liu, F., Li, D., Fernie, A. R. & Chen, W. Strategies for structure elucidation of small molecules based on LC–MS/MS data from complex biological samples. Comput. Struct. Biotechnol. J. 20, 5085–5097 (2022).
6. Huber, F., van der Burg, S., van der Hooft, J. J. J. & Ridder, L. MS2DeepScore: a novel deep learning similarity measure to compare tandem mass spectra. J. Cheminformatics 13, 84 (2021).
7. Wang, M. et al. Mass spectrometry searches using MASST. Nat. Biotechnol. 38, 23–26 (2020).
8. Mongia, M. et al. Fast mass spectrometry search and clustering of untargeted metabolomics data. Nat. Biotechnol. 42, 1672–1677 (2024).