
PFAS identification with MassQL
Per- and polyfluoroalkyl substances (PFAS) are a class of synthetic chemicals known for their durability and resistance to heat, water, and oil. While their many desirable properties make them useful for a wide range of applications, they are also incredibly persistent in the environment. Their widespread use has led to their global accumulation in air, water, soil, animals, and humans, raising concerns about their negative health effects.1,2 While certain PFAS are now banned in many countries, there are still hundreds of PFAS in daily use throughout the globe.3-5
In most cases, regulators perform targeted mass spectrometry to track environmental contaminants, which requires all PFAS are known in advance and have readily-available reference standards. However, PFAS identification is not well-suited to targeted analysis. For one, the sheer number of PFAS makes it challenging for targeted experiments to achieve comprehensive detection. In addition, targeted experiments require purified standards in order to identify target compounds. Reference standards do not exist for many PFAS, especially those that have been recently developed or undergo environmental degradation. Thus, non-targeted screening has become essential for comprehensive identification of PFAS.
Non-targeted (or untargeted) mass spectrometry takes an unbiased approach to compound detection. Instead of measuring a list of target compounds determined in advance, non-targeted analyses measure all compounds in a sample.* This solves the problem of comprehensive detection, but presents another: how to identify PFAS among the thousands of other compounds that were measured in a sample? The following application note demonstrates how the mass spec query language (MassQL) in Ometa Flow can be used to rapidly identify PFAS in non-targeted data.
Step One: Molecular Networking
While MassQL can be run as a standalone workflow, pairing MassQL with molecular networking can improve annotations and highlight compounds that are structurally related to each other. This application note analyzes MS/MS data from three water sources (drinking water, sea water, river water, and blanks, n=3 each ) and can be accessed here. The raw MS/MS data is publicly available in MassIVE under accession MSV000094642.
The molecular networking workflow performs compound identification, peak integration, and networking. In this dataset, the workflow identified 1295 compounds in the 12 samples, only 47 (4%) of which could be annotated using MS/MS spectral libraries. Results can be accessed here. While low compound identification rates are common in water samples, this process did identify some known PFAS (see library matches here). Networking can then provide additional information on which unknown compounds are structurally-related to known PFAS.
Molecular networking groups compounds by their structural similarity. In a network, each compound is represented by a circle (or node) and structurally-related compounds are connected by lines (or edges). This approach can help annotate unknown compounds by comparing them to knowns. For instance, the sub-network below contains 17 compounds. Known compounds with library matches are shown in blue, while unknown compounds are gray. Only one compound in this sub-network has a library match: to the PFAS 1H,1H,2H,2H-Perfluorooctanesulfonic acid. However, this compound is structurally similar to the other compounds in the network, indicating that these unknown compounds are likely novel PFAS.

Sub-network containing library match to PFAS in the molecular network. Visualization can be accessed here.
Step Two: MassQL

Overview of MassQL searches for PFAS. For more information on how to construct a MassQL query, please consult our MassQL blog or video tutorial.
While molecular networking can begin to identify compounds that are structurally-related to known PFAS, MassQL can be used to target these searches even further. There are several methods to identify PFAS in non-targeted data.4,6,7 One is to search for diagnostic MS2 fragments that are shared among PFAS, such as perfluoroalkyl chains (CnF2n+1). For instance, the following is a MassQL query for three perfluoroalkyl chains:8
QUERY scaninfo(MS2DATA) where
MS2PROD=(118.987 OR 168.987 OR 218.986):TOLERANCEMZ=0.05
This query searches for MS2 spectra that contain the C2F5- fragment (MS2PROD) at 118.987 m/z, the C3F7- fragment at 168.987 m/z, or the C4F9- fragment at 218.986 m/z. The mass tolerance (TOLERANCEMZ) for the search is set to 0.05 m/z. The OR between each m/z indicates that the MS2 spectrum must contain one of these three fragments.
While this query will identify long chain PFAS, it may miss short chain PFAS or PFAS degradation products. However, both long and short chain PFAS share mass differences between MS2 peaks that can be used to perform a more comprehensive search. The following query looks for these mass differences:4
QUERY scaninfo(MS2DATA) where
MS2PROD=X AND MS2PROD=X+49.997:TOLERANCEMZ=0.05 AND
MS2PROD=68.995:TOLERANCEMZ=0.05
The query above searches for a loss of CF2 (49.997 m/z) as well as an MS2 peak corresponding to CF3- at 68.995 m/z.
MassQL queries can also be tailored to find specific subclasses of PFAS. For example, the following query finds sulfur-containing PFAS by searching for MS2 peaks corresponding to SO3- (79.9563 m/z) and FSO3- (98.9552 m/z):6
QUERY scaninfo(MS2DATA) WHERE
MS2PROD=79.9563:TOLERANCEMZ=0.05:INTENSITYPERCENT=10 AND
MS2PROD=98.9552:TOLERANCEMZ=0.05:INTENSITYPERCENT=10
This query also uses intensity thresholds (INTENSITYPERCENT) to return peaks that are above 10% of the minimum peak intensity in the data.
A final method for identifying PFAS is ion mobility, where the abundance of fluorine in PFAS creates a unique mobility pattern.7 The following query identifies compounds in a specific part of the mobility-m/z plane and further filters hits based on their mass defect:6
QUERY scaninfo(MS2DATA) WHERE MS2PREC=X AND
MOBILITY=range(min=X*0.0006775+0.40557, max=X*0.00078231+0.48817) AND
X=massdefect(min=0.9, max=0.99)
The queries above are only a few of the potential queries that could be used to identify PFAS with MassQL. The tool’s speed and flexibility make it easy to adapt queries to specific applications as well as iterate and refine queries in real time. In addition, multiple MassQL queries can be searched simultaneously by separating queries with |||. Since the example data used in this analysis does not contain ion mobility information, we performed a MassQL search for the first three queries above. The workflow took 49 seconds to return 85 hits to at least one of the PFAS searches.** Results can be accessed here.
When used in combination with molecular networking, MassQL hits can be visualized within the molecular network. For instance, the network below highlights hits to the first MassQL query for perfluoroalkyl chains. Many of the hits cluster within a handful of sub-networks, indicating that these compounds share structural similarity. Further investigation of this network can identify additional novel PFAS or PFAS degradation products and help refine MassQL queries to precisely target compounds of interest.

Molecular network highlighting nodes containing MS2 peaks at 118.987, 168.987, or 218.986 m/z. Visualization can be accessed here.
Step Three: Statistical Analysis
While MassQL can rapidly identify potential PFAS, statistical analysis can determine which of these compounds is upregulated in different groups. Ometa’s statistics workflow can be run directly downstream of molecular networking and performs blank subtraction, data normalization, and a battery of statistical tests. In this case, the workflow completed in less than 2 minutes and identified several potential PFAS that were differentially abundant in river, ocean, and drinking water.** Results can be accessed here. For instance, the compound below was identified using the first massQL query and is upregulated in drinking water:
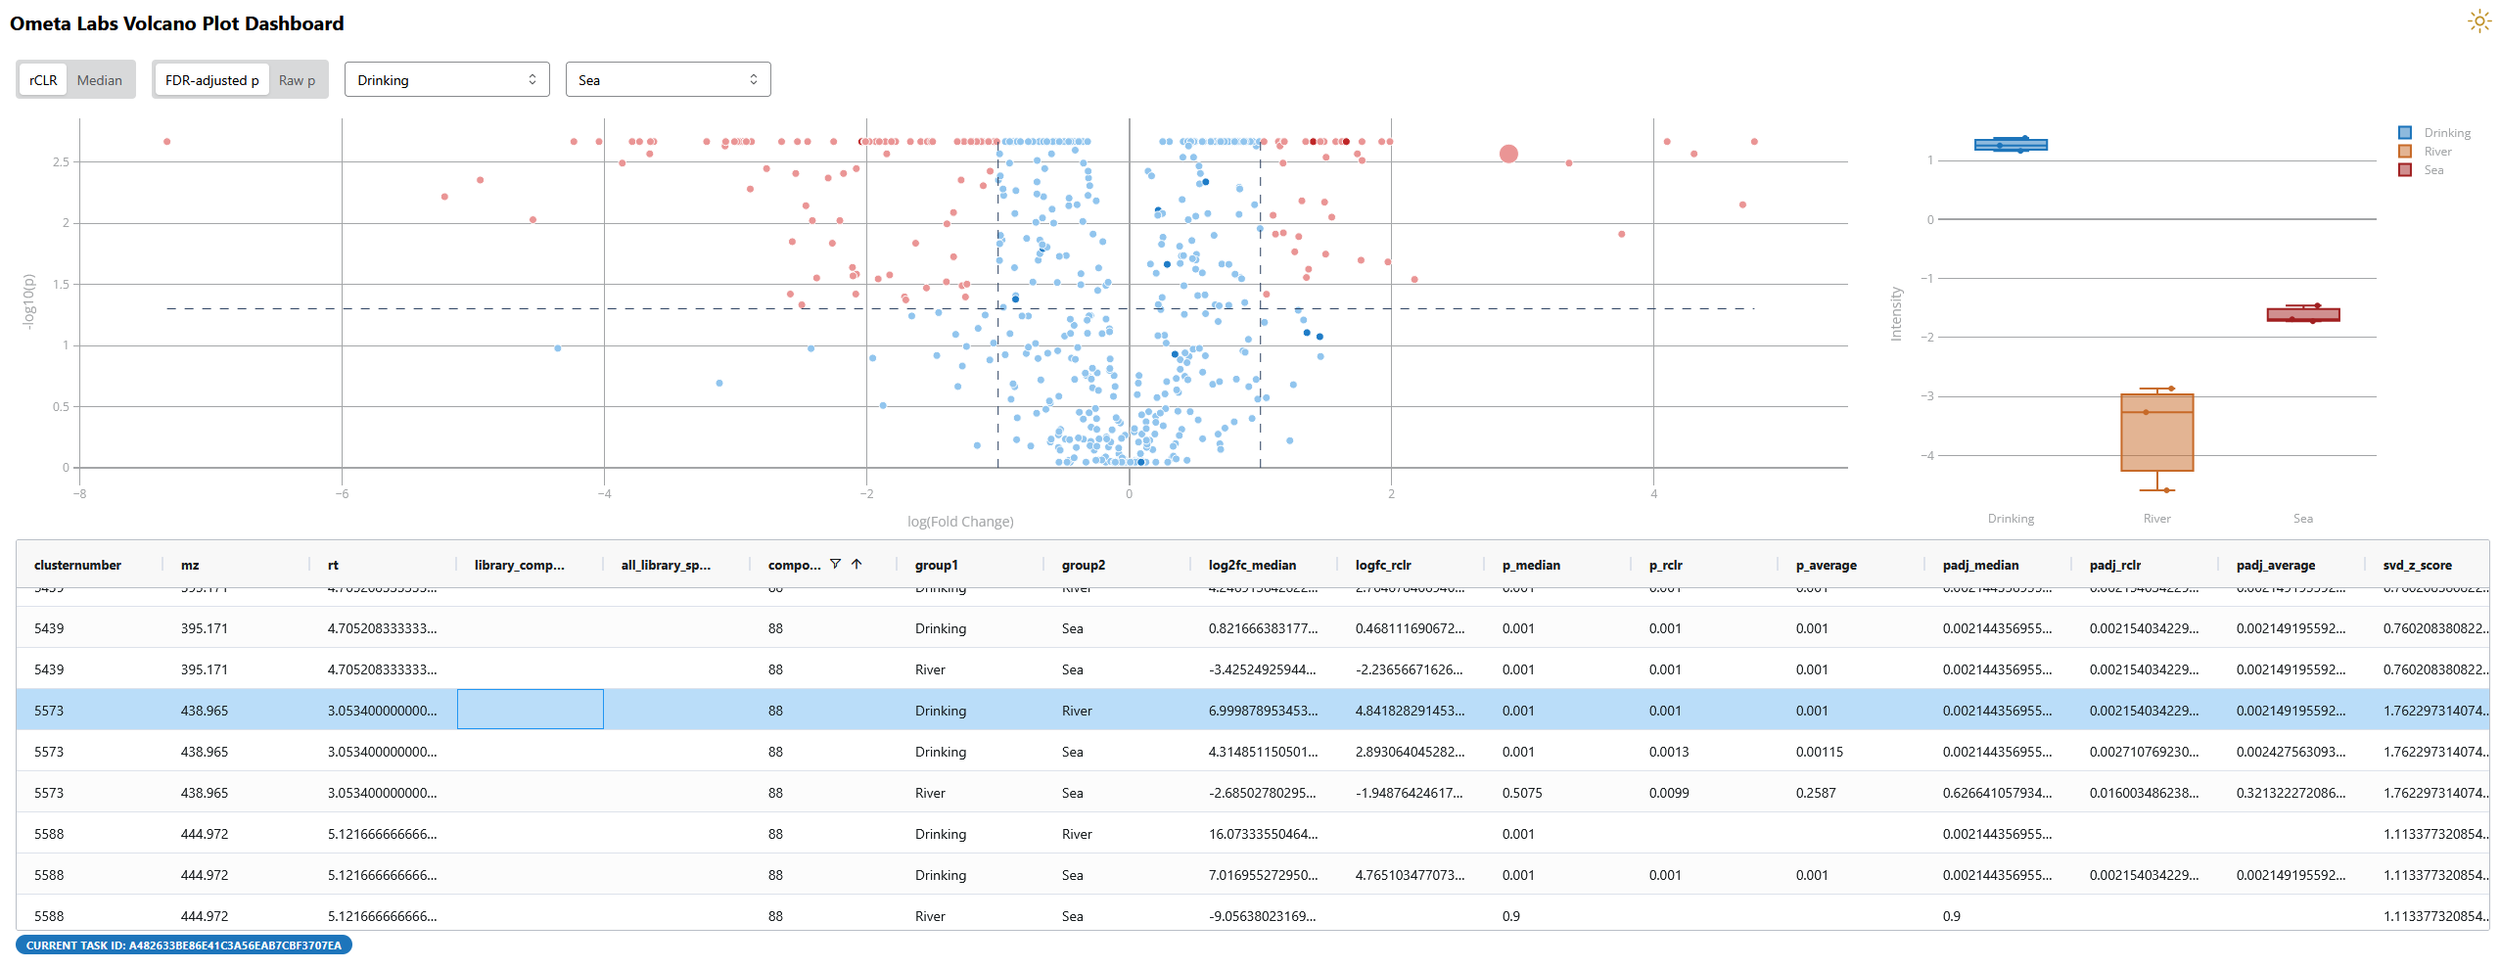
Volcano plot highlighting MassQL hit that is upregulated in drinking water. Visualization can be accessed here.
Step Four: MASST
One of the biggest challenges in regulating PFAS is determining the source of PFAS contamination. The mass spectrometry search tool, or MASST, can rapidly detect novel PFAS (and their analogs) across an entire database of samples. For instance, a search for the compound above and its analogs returned 94 matches across the domainMASST repository containing over 330,000 MS/MS samples in less than a minute. All of these matches were to the same dataset, MSV000092487, which contains samples of dissolved organic matter from two river beds.
MASST can be paired with custom databases to track PFAS across waterways, factories, or other geographic locations. Here’s an example of what this would look like:

If you are interested in building your own custom MASST databases, please contact us.
Summary
Here, we demonstrate how MassQL can rapidly detect PFAS in non-targeted mass spectrometry data and provide context for their distribution and identity.
The workflows highlighted above took MS/MS data with no pre-processing and performed feature extraction, compound identification, peak integration, molecular networking, MassQL searches, statistical analysis, and source tracking in less than an hour.** The standalone MassQL workflow can perform these searches even faster - generally within 5 minutes. Searches can even be performed on the database level to rapidly detect novel PFAS in historical samples and track the distribution of PFAS over time.
Limitations
Non-targeted analyses can only provide qualitative information on the relative abundance of PFAS in different sample groups. If absolute concentrations are required, it is best practice to perform a targeted analysis and compare results to the concentration curve of a purified standard.
Finally, MassQL will only find compounds that exactly match the input query. Thus, it may be necessary to refine MassQL search parameters, as well as mass and intensity tolerances, to best fit your input data.
Have more questions? Contact us.
*Within reason. Experimental parameters affect which molecules end up on the mass spectrometer in sufficient quantities to be detected. Thus, it is still important to optimize sample extraction and instrument settings for PFAS detection when running non-targeted experiments.
**Analyses were run on a local server with 20 Cores and 480GB RAM. Runtimes can be significantly improved by increasing computational resources or migrating to high performance computing (HPC).
References
1. Dimitrakopoulou, M.-E. et al. Comprehensive analysis of PFAS presence from environment to plate. Npj Sci. Food 8, 80 (2024).
2. National Academies of Sciences, Potential Health Effects of PFAS. in Guidance on PFAS Exposure, Testing, and Clinical Follow-Up (National Academies Press (US), 2022).
3. Cousins, I. T. et al. The High Persistence of PFAS is Sufficient for their Management as a Chemical Class. Environ. Sci. Process. Impacts 22, 2307–2312 (2020).
4. Zweigle, J., Bugsel, B. & Zwiener, C. FindPFΔS: Non-Target Screening for PFAS—Comprehensive Data Mining for MS2 Fragment Mass Differences. Anal. Chem. 94, 10788–10796 (2022).
5. EPA, PFAS strategic roadmap: EPA’s commitments to action 2021–2024. Environ. Prot. Agency Wash. DC 20460, (2021).
6. Jarmusch, A. K. et al. A Universal Language for Finding Mass Spectrometry Data Patterns. 2022.08.06.503000 Preprint at https://doi.org/10.1101/2022.08.06.503000 (2022).
7. Dodds, J., Hopkins, Z., Knappe, D. & Baker, E. Rapid Characterization of Per- and Polyfluoroalkyl Substances (PFAS) by Ion Mobility Spectrometry-Mass Spectrometry (IMS-MS). Anal. Chem. 92, 4427–4435 (2020).
8. Kiehne, A. et al. Interactive Design and Application of MassQL Queries after Preprocessing for the Annotation of PFAS in LC-TIMS-PASEF data. (2023).